Efficient generation of HPLC and FTIR data for quality assessment using time series generation model: a case study on Tibetan medicine Shilajit – PubMed Black Hawk Supplements
BLACK HAWK: High quality shilajit supplement for immune system
Published article
CONCLUSION: This study offers a novel and effective approach for researching medicinal materials with small sample sizes, and addresses the limitations of improving model performance through data augmentation strategies.
Black Hawk Supplements, best supplements in the UK

Efficient generation of HPLC and FTIR data for quality assessment using time series generation model: a case study on Tibetan medicine Shilajit
Rong Ding et al. Front Pharmacol. .
Abstract
Background: The scarcity and preciousness of plateau characteristic medicinal plants pose a significant challenge in obtaining sufficient quantities of experimental samples for quality evaluation. Insufficient sample sizes often lead to ambiguous and questionable quality assessments and suboptimal performance in pattern recognition. Shilajit, a popular Tibetan medicine, is harvested from high altitudes above 2000 m, making it difficult to obtain. Additionally, the complex geographical environment results in low uniformity of Shilajit quality.
Methods: To address these challenges, this study employed a deep learning model, time vector quantization variational auto- encoder (TimeVQVAE), to generate data matrices based on chromatographic and spectral for different grades of Shilajit, thereby increasing in the amount of data. Partial least squares discriminant analysis (PLS-DA) was used to identify three grades of Shilajit samples based on original, generated, and combined data.
Results: Compared with the originally generated high performance liquid chromatography (HPLC) and Fourier transform infrared spectroscopy (FTIR) data, the data generated by TimeVQVAE effectively preserved the chemical profile. In the test set, the average matrices for HPLC, FTIR, and combined data increased by 32.2%, 15.9%, and 23.0%, respectively. On the real test data, the PLS-DA model’s classification accuracy initially reached a maximum of 0.7905. However, after incorporating TimeVQVAE-generated data, the accuracy significantly improved, reaching 0.9442 in the test set. Additionally, the PLS-DA model trained with the fused data showed enhanced stability.
Conclusion: This study offers a novel and effective approach for researching medicinal materials with small sample sizes, and addresses the limitations of improving model performance through data augmentation strategies.
Keywords: FTIR; HPLC; Shilajit; classification; time series generation.
Copyright © 2024 Ding, He, Wu, Zhong, Chen and Gu.
Conflict of interest statement
The authors declare that the research was conducted in the absence of any commercial or financial relationships that could be construed as a potential conflict of interest.
Figures

Overview of our proposed VQ (i.e., tokenization) (stage 1, The encoder and the decoder are denoted by E and D respectively. STFT and ISTFT stand for Short-time Fourier Transform and Inverse Short-time Fourier Transform, respectively.).

(A) Overview of the prior model training (stage 2). (B) Overview of MaskGIT’s iterative decoding. The TopK operation is equivalent to torch.topk from PyTorch. (The dark green block represents the [MASK] token.).

Principles of dataset partitioning.

The second-order guide spectrogram of the infrared spectrum of medicinal materials, H is high quality, M is medium quality, and L is low quality.

Loss variation for training and validation sets with different data sources.

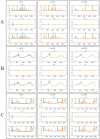
Visualization of generated results at three epochs (13, 623, and 1989) during the training process. The blue line represents the original time-series data, the yellow line represents the predicted data. x_l refers to the low-frequency component of the time-series signal, x_h refers to the high-frequency component of the time-series signal, x represents the time series data generated or predicted. (A) HPLC. (B) FTIR. (C) HPLC_FTIR.

PCA and T-SNE visual mapping of test samples (blue points) and generated samples (yellow points). (A) PCA original data direct mapping. (B) PCA mapping of data in latent space. (C) T-SNE original data direct mapping. (D) T-SNE mapping of data in latent space. (E) HPLC. (F) FTIR. (G) HPLC_FTIR.

The mean and standard deviation of the generated data and the real data, H is high quality, M is medium quality, and L is low quality. (A) HPLC. (B) Generated HPLC. (C) FTIR. (D) Generated FTIR.

Selection of the number of latent variables through 10-Fold cross-validation, the red line and the blue line are the accuracy of the model on the training set and the average accuracy on the cross-validation set under different numbers of latent variables. (A) HPLC. (B) FTIR. (C) HPLC-FTIR. (D) HPLC-TimeVQVAE. (E) FTIR-TimeVQVAE. (F) HPLC_FTIR-TimeVQVAE.

Analysis of Explained variance in X and Y Blocks in PLS-DA model. (A) HPLC. (B) FTIR. (C) HPLC-FTIR. (D) HPLC-TimeVQVAE. (E) FTIR-TimeVQVAE. (F) HPLC-FTIR-TimeVQVAE.

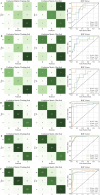
Confusion matrix and ROC curves on the test set, H is high quality, M is medium quality, and L is low quality. (A) HPLC. (B) FTIR; (C) HPLC-FTIR; (D) HPLC-TimeVQVAE; (E) FTIR-TimeVQVAE; (F) HPLC-FTIR-TimeVQVAE.
References
-
- Adib E., Fernandez A. S., Afghah F., Prevost J. J. (2023). Synthetic ECG Signal generation using probabilistic diffusion models. IEEE Access 11, 75818–75828. 10.1109/ACCESS.2023.3296542 – DOI
-
- Bhavsar S. K., Thaker A. M., Malik J. K. (2016). in Chapter 51 – Shilajit. Nutraceuticals . Editor Gupta R. C. (Boston: Academic Press; ), 707–716. 10.1016/B978-0-12-802147-7.00051-6 – DOI
Grants and funding
The author(s) declare that financial support was received for the research, authorship, and/or publication of this article. This work was supported by the supported by the National Natural Science Foundation of China (Grant number: 82274208).
BLACK HAWK: Best lions mane supplement for dads
Read the original publication: